library(ggplot2)
# Function to simulate data and calculate power for Kruskal-Wallis test
simulate_kruskal_power <- function(n_groups, n_per_group, effect_size, n_simulations = 1000, alpha = 0.05) {
power_results <- replicate(n_simulations, {
# Simulate data for each group
groups <- lapply(1:n_groups, function(i) {
rnorm(n_per_group, mean = i * effect_size, sd = 1)
})
# Combine into a data frame
data <- data.frame(
value = unlist(groups),
group = factor(rep(1:n_groups, each = n_per_group))
)
# Perform Kruskal-Wallis test
test_result <- kruskal.test(value ~ group, data = data)
# Check if p-value is less than alpha
test_result$p.value < alpha
})
# Calculate power as the proportion of significant results
mean(power_results)
}
# Function to simulate data and calculate power for Wilcoxon rank-sum test
simulate_wilcoxon_power <- function(n_per_group, effect_size, n_simulations = 1000, alpha = 0.05) {
power_results <- replicate(n_simulations, {
# Simulate data for two groups
group1 <- rnorm(n_per_group, mean = 0, sd = 1)
group2 <- rnorm(n_per_group, mean = effect_size, sd = 1)
# Perform Wilcoxon rank-sum test
test_result <- wilcox.test(group1, group2)
# Check if p-value is less than alpha
test_result$p.value < alpha
})
# Calculate power as the proportion of significant results
mean(power_results)
}
# Parameters for simulation
n_groups <- 3 # Number of groups for Kruskal-Wallis
n_per_group <- 30 # Sample size per group
effect_sizes <- seq(0, 1, by = 0.1) # Range of effect sizes
n_simulations <- 1000 # Number of simulations
# Calculate power for Kruskal-Wallis test
kruskal_power <- sapply(effect_sizes, function(effect_size) {
simulate_kruskal_power(n_groups, n_per_group, effect_size, n_simulations)
})
# Calculate power for Wilcoxon rank-sum test
wilcoxon_power <- sapply(effect_sizes, function(effect_size) {
simulate_wilcoxon_power(n_per_group, effect_size, n_simulations)
})
# Combine results into a data frame
power_results <- data.frame(
effect_size = effect_sizes,
kruskal_power = kruskal_power,
wilcoxon_power = wilcoxon_power
)
# Plot the power curves
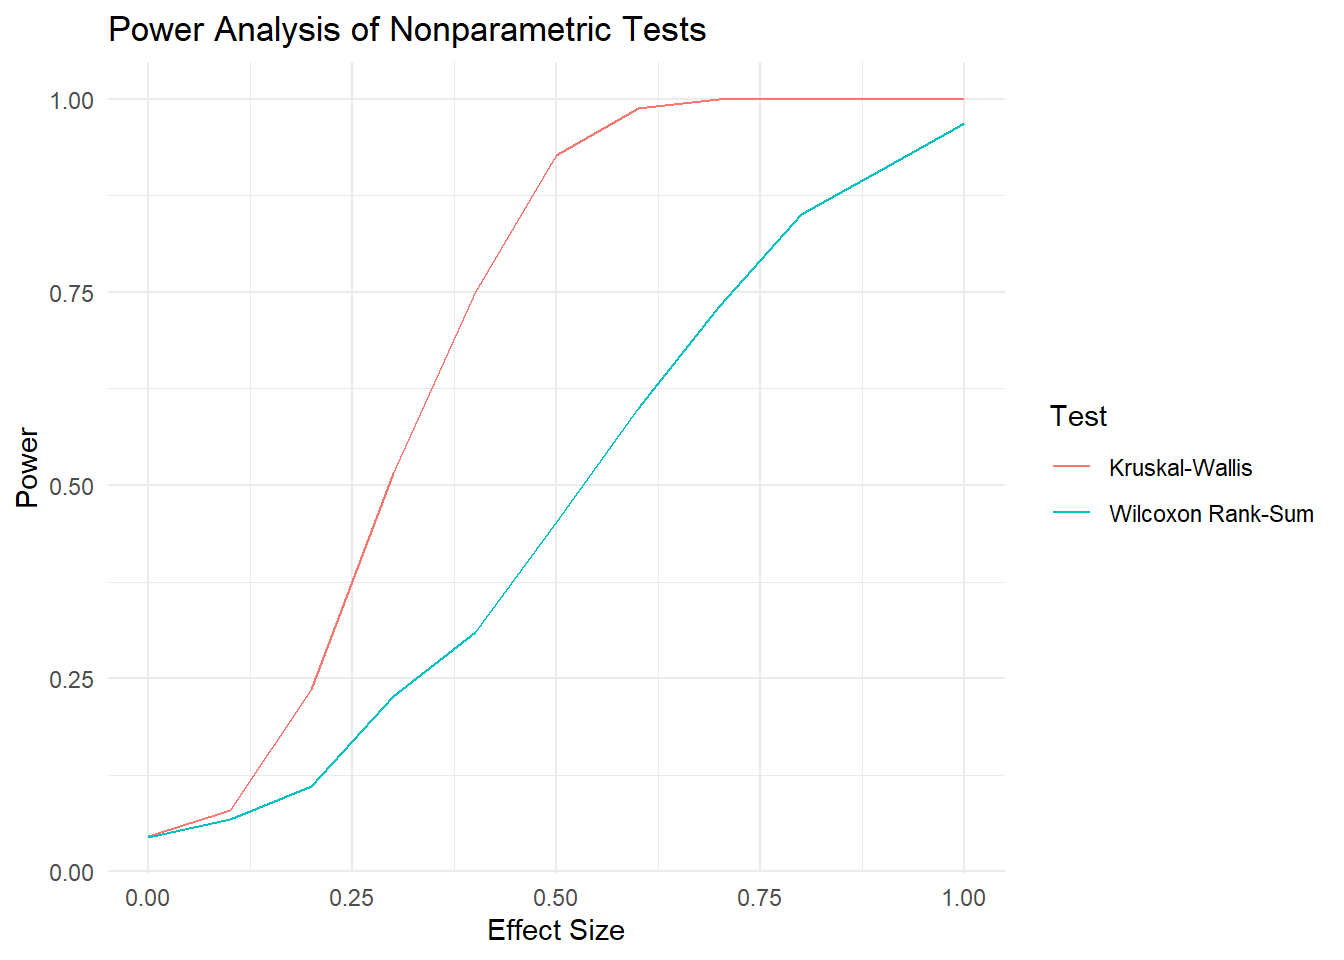
ggplot(power_results, aes(x = effect_size)) +
geom_line(aes(y = kruskal_power, color = "Kruskal-Wallis")) +
geom_line(aes(y = wilcoxon_power, color = "Wilcoxon Rank-Sum")) +
labs(
title = "Power Analysis of Nonparametric Tests",
x = "Effect Size",
y = "Power",
color = "Test"
) +
theme_minimal()