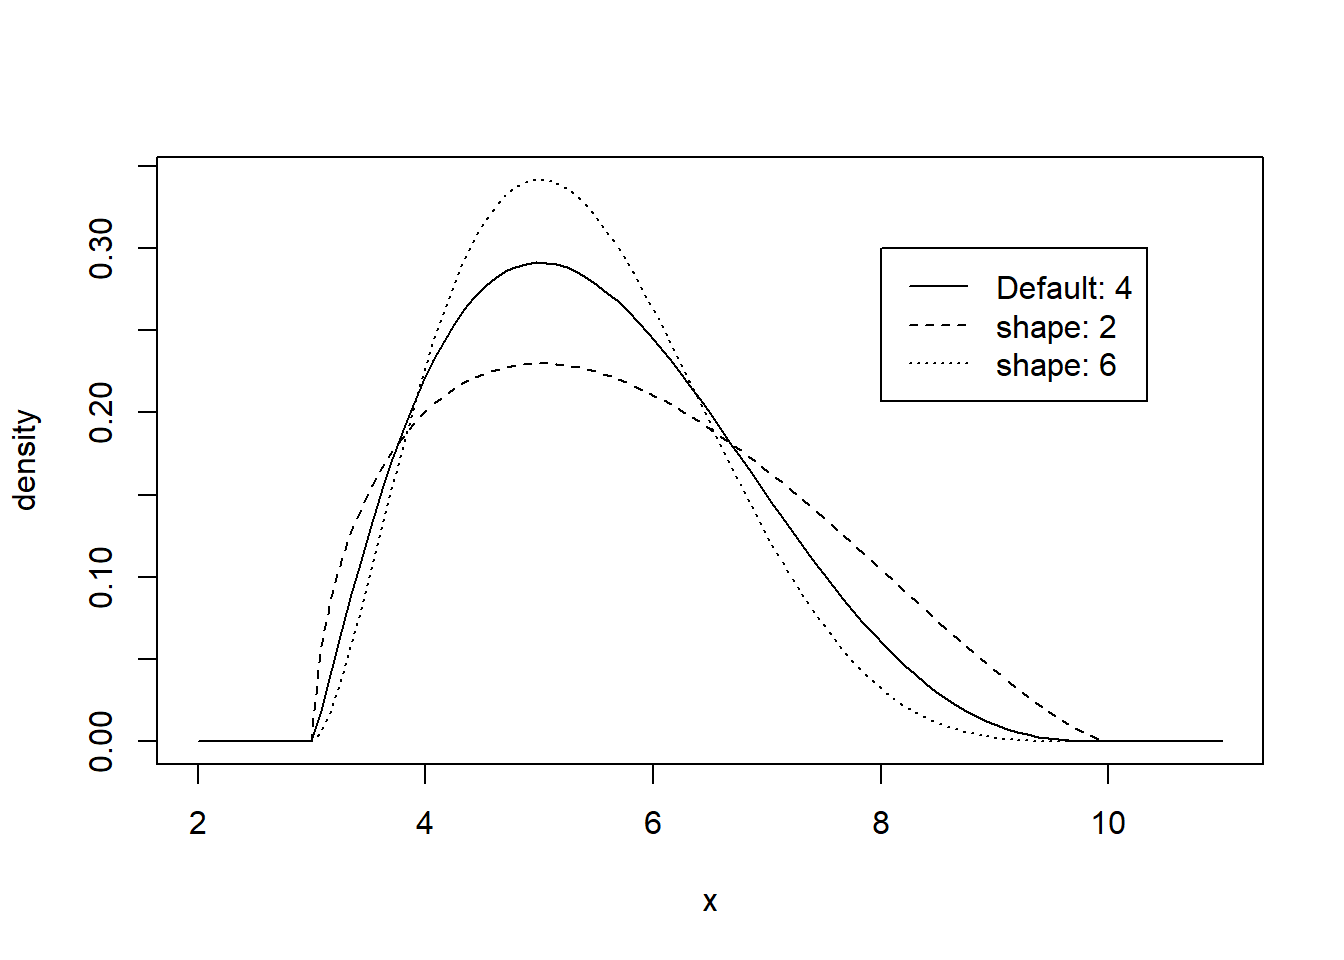
Look at the shape parameters of the pert distribution. The default is 4. The smaller the shape parameter, the more peaked the distribution. The larger the shape parameter, the more flat the distribution.
# Priorslibrary(mc2d)
Warning: package 'mc2d' was built under R version 4.4.2
Loading required package: mvtnorm
Attaching package: 'mc2d'
The following objects are masked from 'package:base':

    pmax, pmin
curve(dpert(x,min=3,mode=5,max=10,shape=6), from =2, to =11, lty=3,ylab="density")curve(dpert(x,min=3,mode=5,max=10), from =2, to =11, add=TRUE)curve(dpert(x,min=3,mode=5,max=10,shape=2), from =2, to =11, add=TRUE,lty=2)legend(x =8, y = .30, c("Default: 4","shape: 2","shape: 6"), lty=1:3)