Dose Finding Studies and Multiple Contrast Test

code
analysis
Understanding MCPMod
Author

Zhenglei Gao

Published

January 6, 2025

Materials and Resouces

  • https://github.com/openpharma/DoseFinding/
  • MCP-Mod FAQ

Performing MCT

library(DoseFinding)
Loading required package: ggplot2
Loading required package: lattice
Loading required package: mvtnorm
data(IBScovars)
library(drc)
Warning: package 'drc' was built under R version 4.4.2
Loading required package: MASS

'drc' has been loaded.
Please cite R and 'drc' if used for a publication,
for references type 'citation()' and 'citation('drc')'.

Attaching package: 'drc'
The following objects are masked from 'package:DoseFinding':

    ED, logistic
The following objects are masked from 'package:stats':

    gaussian, getInitial
ggplot(IBScovars, aes(x=dose, y=resp, color=gender)) +
  geom_point(position = position_dodge(width = 0.5)) 

## set random seed to ensure reproducible adj. p-values for multiple contrast test
set.seed(12)

## perform (model based) multiple contrast test
## define candidate dose-response shapes
models <- Mods(linear = NULL, emax = 0.2, quadratic = -0.17,
               doses = c(0, 1, 2, 3, 4))
## plot models
plot(models)

## fit non-linear emax dose-response model
fitemax <- fitMod(dose, resp, data=IBScovars, model="emax",
                  bnds = c(0.01,5))
## display fitted dose-effect curve
plot(fitemax, CI=TRUE, plotData="meansCI")

## fit non-linear emax dose-response model
fitlogistic <- fitMod(dose, resp, data=IBScovars, model="exponential")
Message: Need bounds in "bnds" for nonlinear models, using default bounds from "defBnds".
## display fitted dose-effect curve
plot(fitlogistic, CI=TRUE, plotData="meansCI")

## perform multiple contrast test
MCTtest(dose, resp, IBScovars, models=models,
                addCovars = ~ gender)
Multiple Contrast Test

Contrasts:
  linear   emax quadratic
0 -0.616 -0.889    -0.815
1 -0.338  0.135    -0.140
2  0.002  0.226     0.294
3  0.315  0.252     0.407
4  0.638  0.276     0.254

Contrast Correlation:
          linear  emax quadratic
linear     1.000 0.768     0.843
emax       0.768 1.000     0.948
quadratic  0.843 0.948     1.000

Multiple Contrast Test:
          t-Stat   adj-p
emax       3.208 0.00128
quadratic  3.083 0.00228
linear     2.640 0.00848

Targe Dose / MED

Differences between TD and ED

library(DoseFinding)
library(ggplot2)
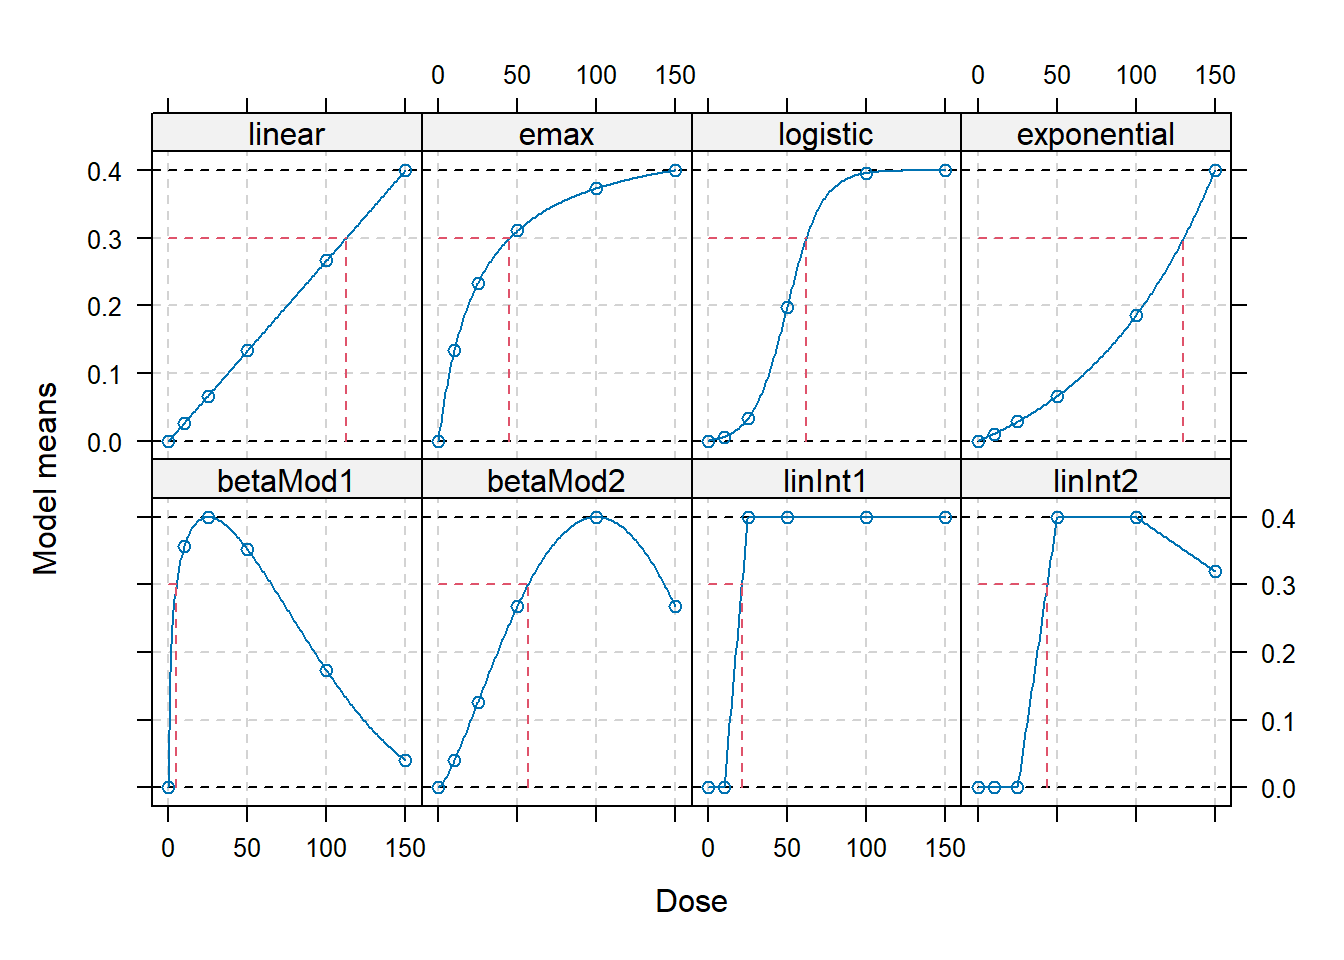
## example for creating a "full-model" candidate set placebo response
## and maxEff already fixed in Mods call
doses <- c(0, 10, 25, 50, 100, 150)
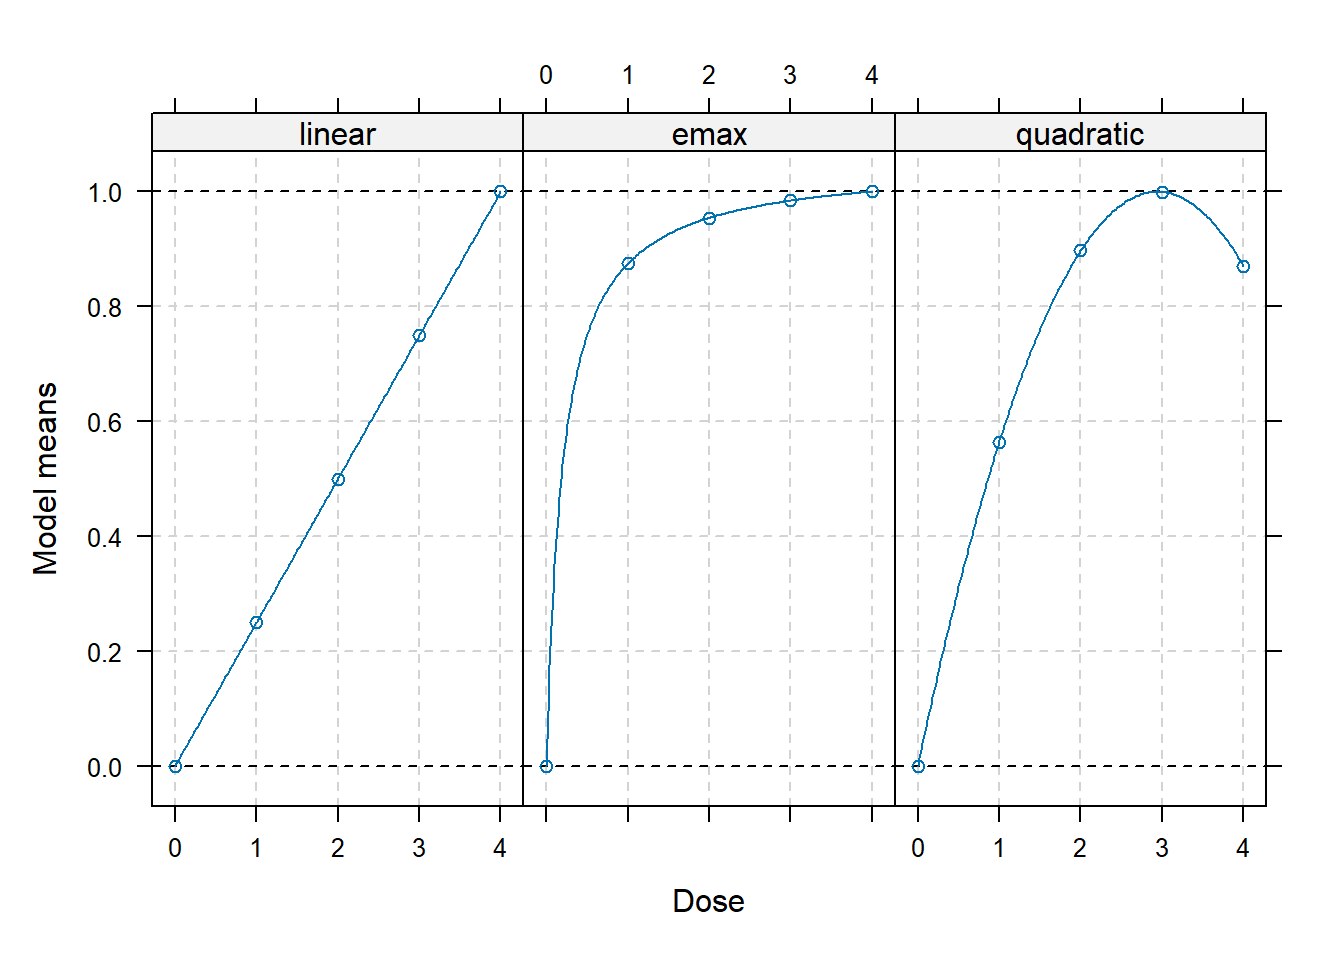
fmodels <- Mods(linear = NULL, emax = 25,
logistic = c(50, 10.88111), exponential = 85,
betaMod = rbind(c(0.33, 2.31), c(1.39, 1.39)),
linInt = rbind(c(0, 1, 1, 1, 1),
c(0, 0, 1, 1, 0.8)),
doses=doses, placEff = 0, maxEff = 0.4,
addArgs=list(scal=200))
## calculate doses giving an improvement of 0.3 over placebo
## Target doses 63
TD(fmodels, Delta=0.3)
     linear        emax    logistic exponential    betaMod1    betaMod2 
 112.500000   45.000000   62.095220  130.265330    4.880978   56.762044 
    linInt1     linInt2 
  21.250000   43.750000 
## discrete version
TD(fmodels, Delta=0.3, TDtype = "discrete", doses=doses)
     linear        emax    logistic exponential    betaMod1    betaMod2 
        150          50         100         150          10         100 
    linInt1     linInt2 
         25          50 
## doses giving 50% of the maximum effect
DoseFinding::ED(fmodels, p=0.5)
     linear        emax    logistic exponential    betaMod1    betaMod2 
  75.000000   18.750000   50.215409  104.517639    1.255838   37.337384 
    linInt1     linInt2 
         NA          NA 
DoseFinding::ED(fmodels, p=0.5, EDtype = "discrete", doses=doses)
     linear        emax    logistic exponential    betaMod1    betaMod2 
        100          25         100         150          10          50 
    linInt1     linInt2 
         25          50 
plot(fmodels, plotTD = TRUE, Delta = 0.3)

References

  • Hothorn, T., Bretz, F., and Westfall, P. (2008). Simultaneous Inference in General Parametric Models, Biometrical Journal, 50, 346–363

  • Pinheiro, J. C., Bornkamp, B., Glimm, E. and Bretz, F. (2014) Model-based dose finding under model uncertainty using general parametric models, Statistics in Medicine, 33, 1646–1661